
Graphing Calculator
Plot functions, explore graphs, and visualize equations right in your browser. This free online graphing calculator lets you draw multiple functions at once, zoom in on key points, and see how equations behave — no downloads, no sign-up, no cost. Whether you are working on algebra homework, preparing for a calculus exam, or teaching math concepts in class, you can start graphing in seconds.
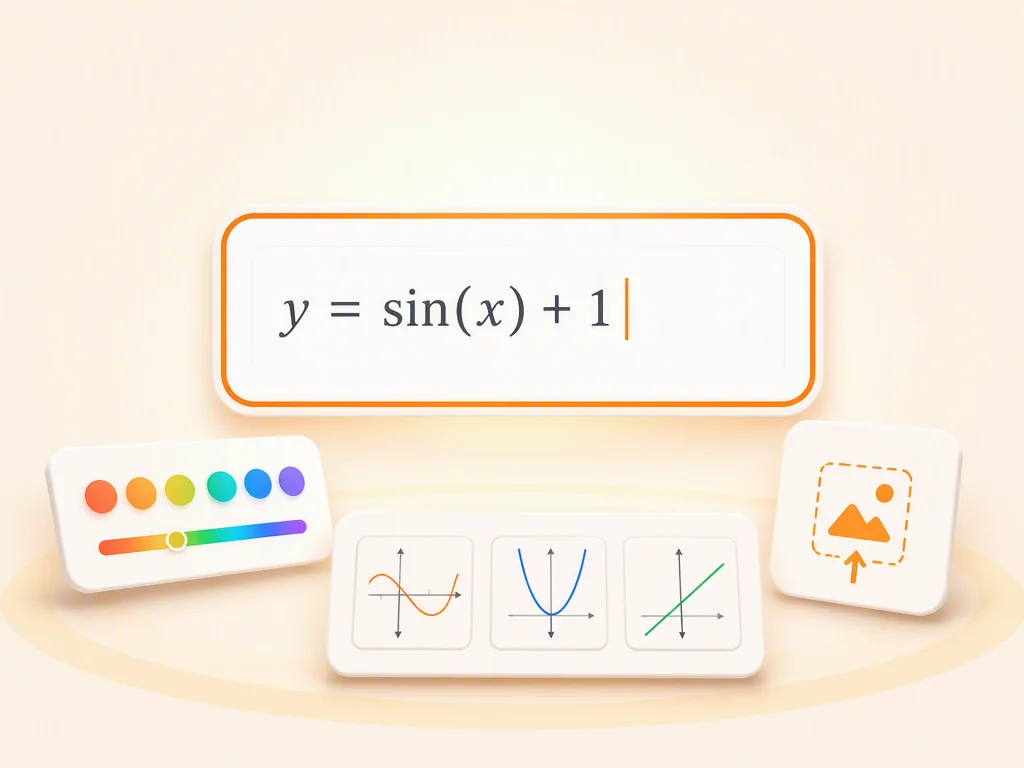
What You Can Do with This Graphing Calculator
Plot Multiple Functions on One Graph
Enter any function — linear, quadratic, trigonometric, exponential, or logarithmic — and see it drawn instantly. You can add multiple equations to the same graph, each in a different color, making it easy to compare how functions behave side by side. This function graphing calculator supports standard math notation, so you type equations the way you write them. For more complex calculus problems, you can also use our step-by-step calculus solver to verify your solutions.
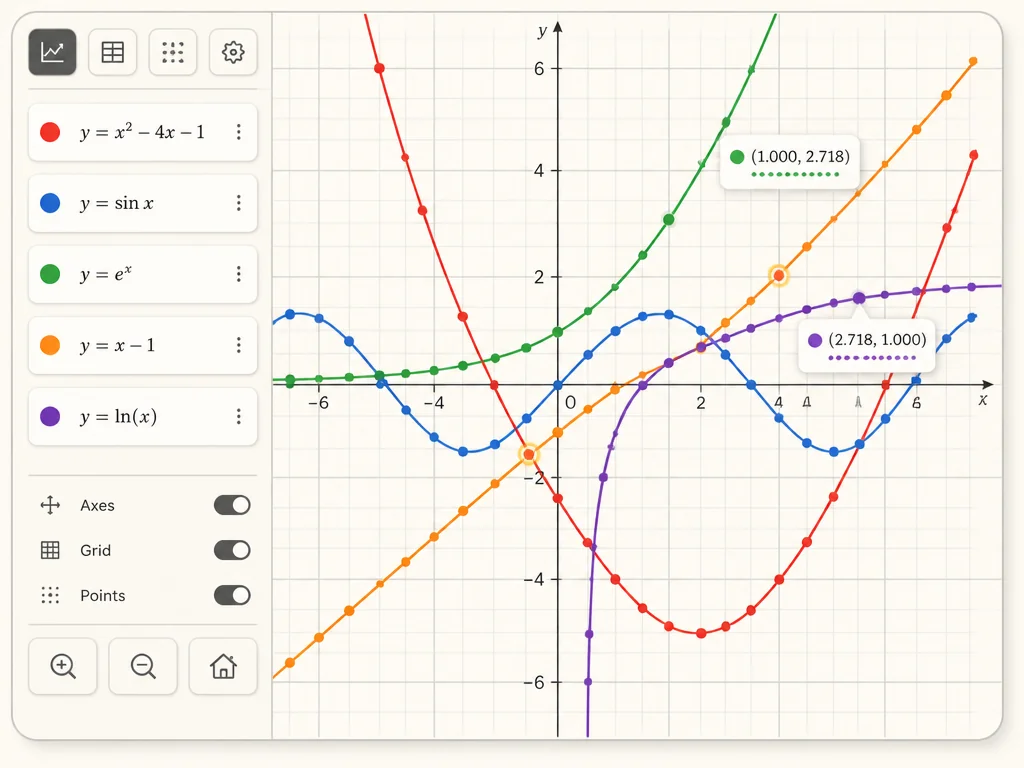
Interactive Graph Controls for Deeper Exploration
Zoom, pan, and trace along any curve to find intercepts, turning points, and asymptotes. Adjust the viewing window, toggle grid lines, and hover over any point to see exact coordinates. This interactive graphing calculator gives you real-time visual feedback — as you modify an equation, the graph updates instantly. It turns abstract math into something you can see, move, and explore at your own pace.
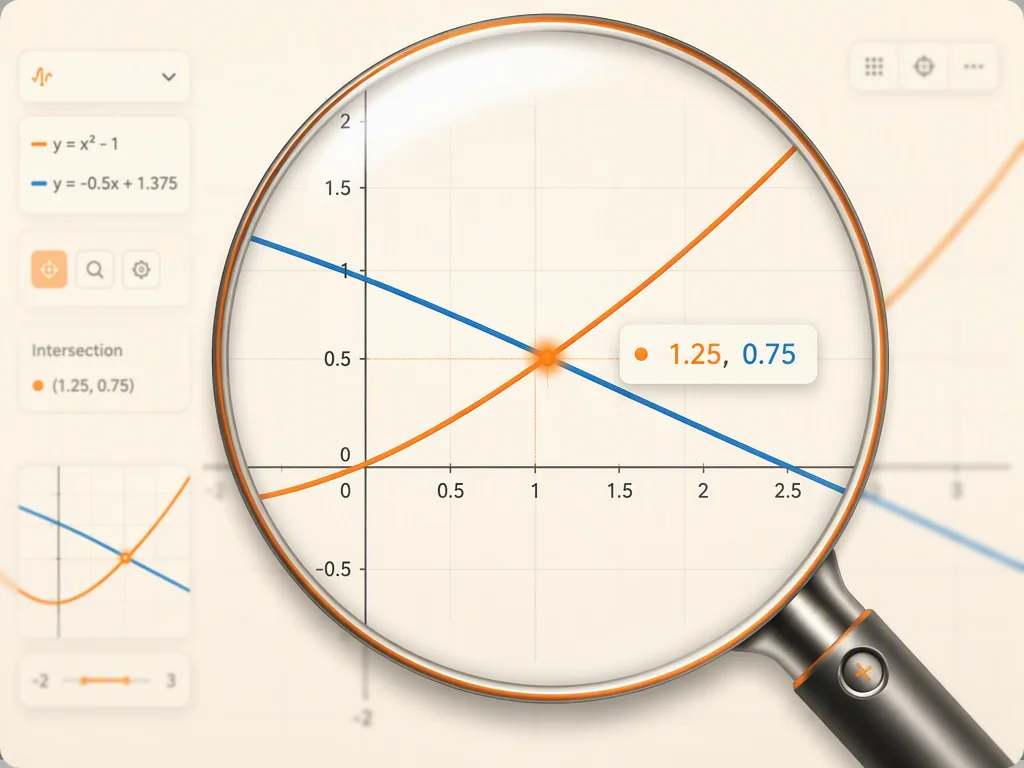
Plot, Compare, and Understand Functions Visually
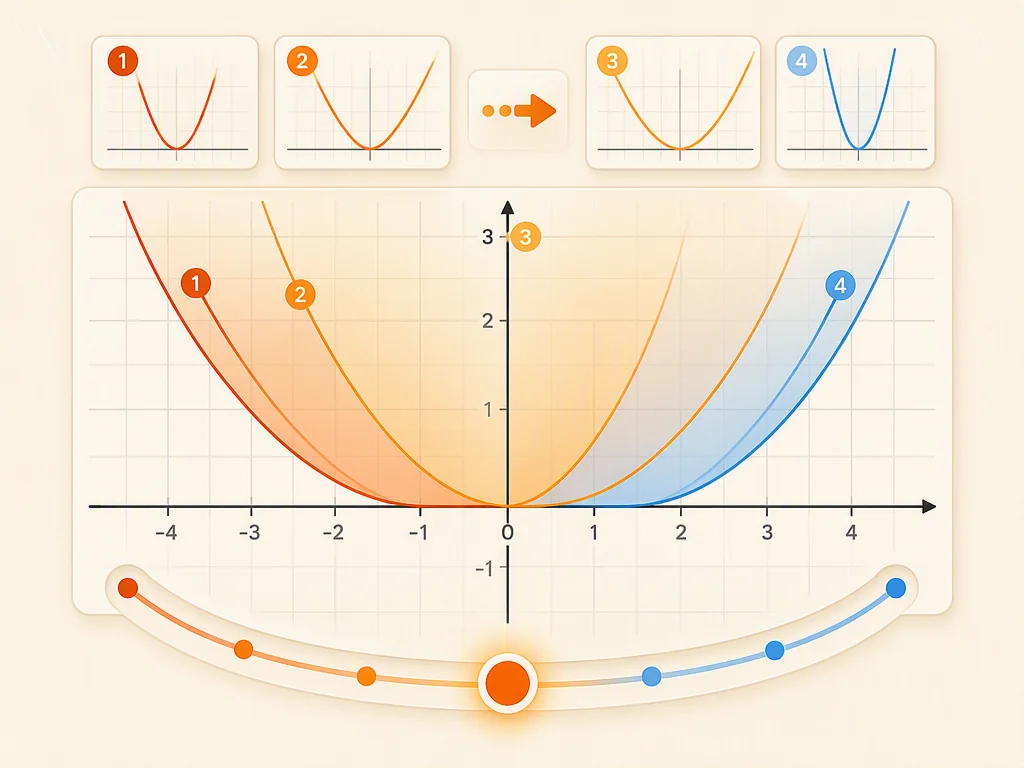
Add multiple functions on the same coordinate plane and compare them side by side. Change a parameter and watch the curve shift in real time. Find where two functions intersect, zoom in on key points, and explore what happens near asymptotes. Beyond standard functions, you can enter commands to visualize advanced concepts — plot a derivative by typing it yourself, shade the area under a curve, or trace along a path to examine function behavior in detail. This calculator with graphing puts you in control, helping you build intuition through hands-on exploration rather than passive observation. If you are looking for guided explanations as you explore, an interactive AI math tutor can walk you through each concept step by step.
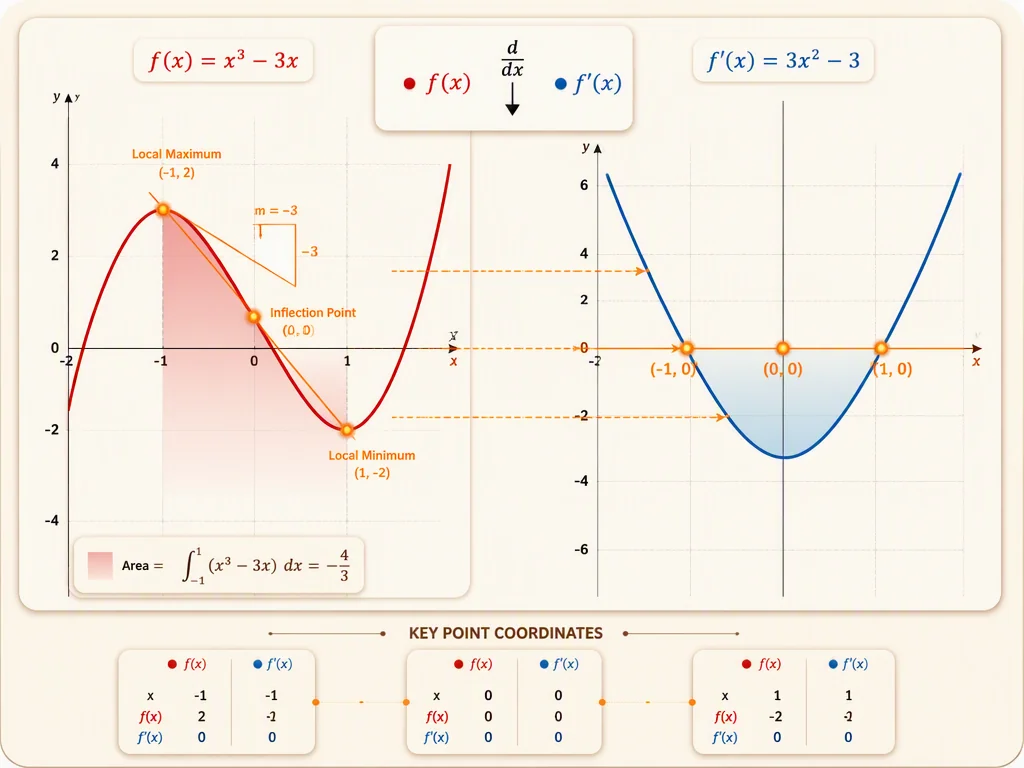
Real-Time Visualization for Faster Learning
As you type or modify an equation, the graph updates in real time. This instant feedback helps you understand how changing parameters — like slope, intercept, or amplitude — affects the shape of a function. It is especially useful for learning transformations, exploring function families, and checking your homework visually. You can also use our guided homework helper to turn any problem into a learning moment with detailed explanations.
How to Use This Free Graphing Calculator
Enter Your Equation
Type any function into the input field using standard math notation — y = x^2 + 2x + 1, y = sin(x), y = ln(x), or any expression you need to visualize. The graphing calculator accepts linear, polynomial, trigonometric, exponential, and logarithmic functions, and supports constants like π and e.
Customize Your Graph
Adjust the x and y axis ranges, toggle grid lines, and pick a color for each function you plot. You can add multiple equations on the same plane, making it easy to compare several functions or explore families of curves in a single view.
Explore and Learn
Click any point on the graph to see exact coordinates. Trace along curves to find intercepts, maximum and minimum values, and intersection points. Zoom into specific regions to examine details. Each interaction helps you see how math works — not just memorize it.
Where a Graphing Calculator Makes a Difference
Algebra and Pre-Calculus Homework
When you are working through linear equations, quadratics, polynomials, or rational functions, seeing the graph makes everything clearer. Use this free graphing calculator to check your work, understand domain and range visually, and confirm that your algebraic solutions match the graph. It turns abstract equations into pictures you can explore.
Calculus Exam Preparation
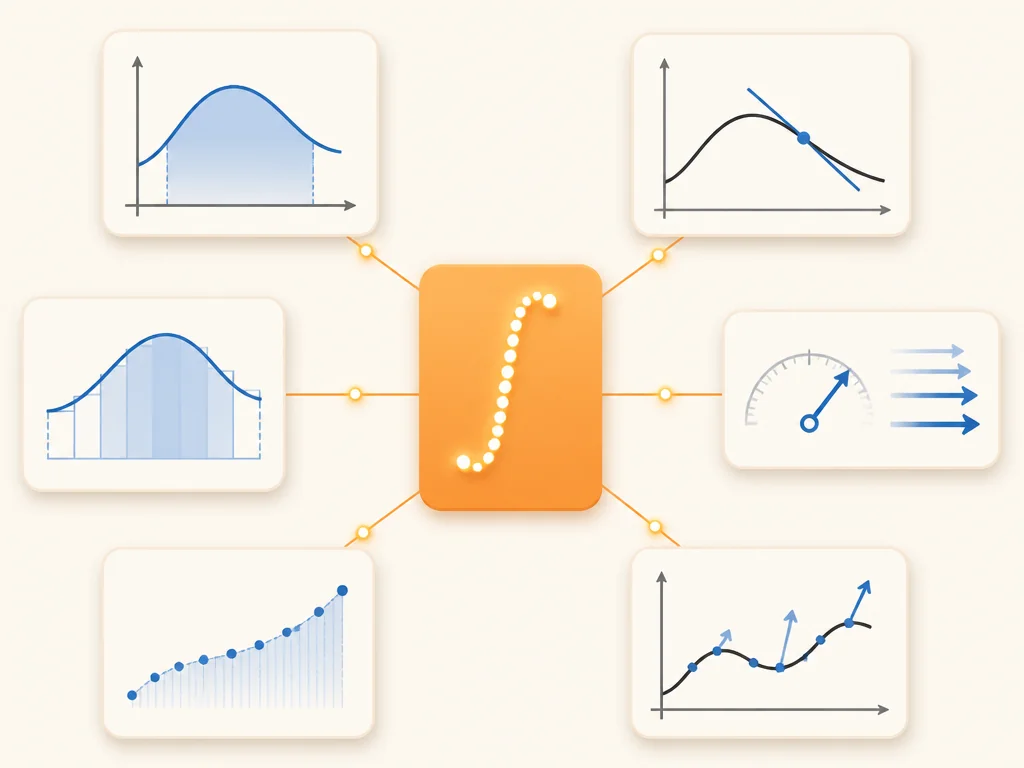
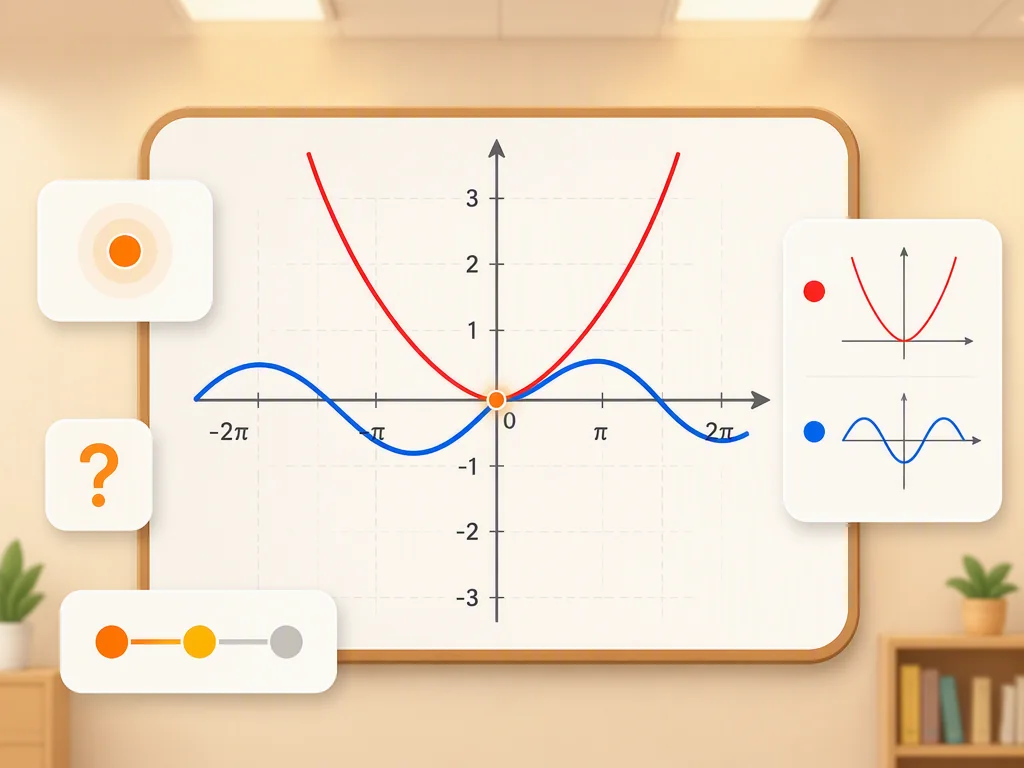
For limits, derivatives, integrals, and curve analysis, an online calculus graphing calculator helps you see the big picture before diving into calculations. You can plot a function, then manually enter its derivative as a separate equation to compare the two curves on the same graph. Use shading commands to visualize the area under a curve before integrating, or trace along functions to estimate limits. With command-based exploration, you stay in control of what you see — while still getting the visual feedback that makes calculus concepts click.
Classroom Teaching and Demonstrations
Teachers can project this online graphing calculator onto the board during lessons. Modify equations in real time, let students predict how the graph will change, and verify their predictions instantly. Whether introducing transformations, solving systems of equations graphically, or explaining asymptotes, an interactive visual makes abstract concepts concrete.
Building Confidence Through Self-Study
Learning math on your own works best when you can test ideas and see results immediately. Use this graphing calculator online to try new functions, check your predictions, and build intuition at your own pace. The instant visual feedback reinforces what you learn and turns mistakes into discoveries instead of frustrations.
Why Use This Graphing Calculator
Free and Ready to Use — No Account Needed
Start graphing immediately without creating an account, downloading software, or entering payment information. It works right in your browser on any device.
See Your Math Come to Life Instantly
As you type, the graph appears in real time. Modify an equation and watch the curve shift immediately. This instant connection between algebra and geometry helps you build understanding faster than working on paper alone.
Wide Function Support for Real Coursework
From simple linear equations to trigonometric, exponential, logarithmic, and rational functions — this function graphing calculator handles the math you actually encounter in class, homework, and exams.
Interactive Controls That Help You Learn
Zoom, pan, trace, and adjust your view without refreshing. The interactive graphing calculator puts you in control — explore at your own pace and discover how functions behave through direct manipulation rather than passive observation.
Multiple Functions, One Clear View
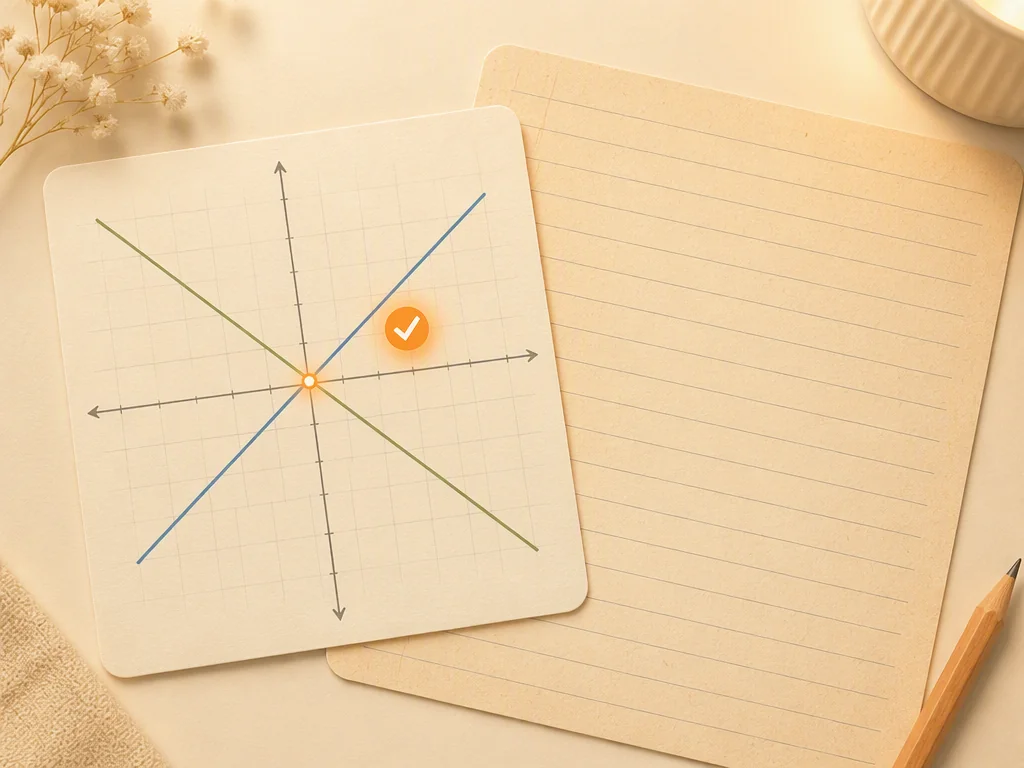
Plot multiple equations simultaneously with distinct colors. Compare function families, find intersections, and see how changing one equation affects its relationship to others — all on one coordinated plane.
Works Across All Your Devices
Use it on a laptop in class, a tablet at home, or a phone on the go. The graphing calculator adapts to your screen size and works smoothly in any modern browser, so your tools are always where you need them.
Real Ways Students and Teachers Use This Graphing Calculator





Ready to Start Graphing? Try This Free Online Graphing Calculator Now
Frequently Asked Questions About the Graphing Calculator
A graphing calculator is a tool that lets you enter mathematical equations and see their graphs on a coordinate plane. Unlike a basic calculator that only shows numbers, an online graphing calculator visualizes functions so you can see how equations behave — where they cross axes, where they reach high and low points, and how different functions compare.
Yes. This free graphing calculator is available at no cost with daily free usage. You can plot functions, customize your graph view, and explore equations right in your browser without creating an account or entering payment information. Paid plans with extended daily usage are also available for users who need them.
Yes. This online calculus graphing calculator works well for limits, derivatives, integrals, and curve analysis. You can manually enter a derivative as a separate equation to plot it alongside the original function, use shading commands to highlight the area under a curve, trace along functions to estimate limits, and explore behavior near asymptotes — all through command-based exploration that keeps you in control of what you see.
You can plot linear functions, quadratic equations, polynomials, trigonometric functions (sine, cosine, tangent), exponential and logarithmic functions, absolute value functions, and rational functions. The graphing calculator uses standard math notation, so you type equations the same way you write them on paper.
Unlike a physical calculator you buy and carry, this online graphing calculator runs in your browser on any device — no purchase, no batteries, no software updates. It also offers a larger display, supports more functions at once, and updates graphs in real time as you modify equations, making it easier to learn through exploration.
Yes. Equations you enter are processed securely to generate graphs, and we do not store your input data. Please refer to our privacy policy for complete details on how your information is handled and protected.