
Compute 16 essential statistics from a list of numbers — mean, median, mode, standard deviation, quartiles, and more.
Separate numbers with commas, spaces, or new lines. Supports negatives and scientific notation (e.g. 1.5e3).
| x̄ | Mean | — |
| Med | Median | — |
| — | Mode | — |
| GM | Geometric Mean | — |
| σ | Population Std Dev | — |
| s | Sample Std Dev | — |
| σ² | Population Variance | — |
| s² | Sample Variance | — |
| R | Range | — |
| Min | Minimum | — |
| Max | Maximum | — |
| Q1 | Q1 (25th Percentile) | — |
| Q3 | Q3 (75th Percentile) | — |
| IQR | IQR | — |
| n | Count | — |
| Σx | Sum | — |
Statistics Calculator — Free Online Tool for Descriptive Statistics
Enter your data and get a complete statistical summary in seconds. This tool computes 13 essential measures — mean, median, mode, range, standard deviation, variance, and geometric mean — all in one place. Whether you are a student checking homework, a teacher preparing lesson materials, or a researcher validating data, you will get accurate results with clear, organized outputs. No downloads, no sign-up required. Just paste your numbers and let the calculator handle the rest. If you need deeper analysis or want to understand the math behind each result, pair it with our AI math solver for guided explanations.

What This Statistics Calculator Can Do for You
Descriptive Statistics Calculator — 13 Key Measures in One Click
This descriptive statistics calculator covers every fundamental measure you need. It calculates count, sum, mean, median, mode, largest value, smallest value, and range for a quick overview of your data. For deeper analysis, it also computes geometric mean for growth rates and proportional data, plus both population standard deviation and sample standard deviation with their corresponding variances. Instead of jumping between multiple tools, you get everything in a single, clean result panel.
Understanding Data Spread — Standard Deviation and Variance Explained
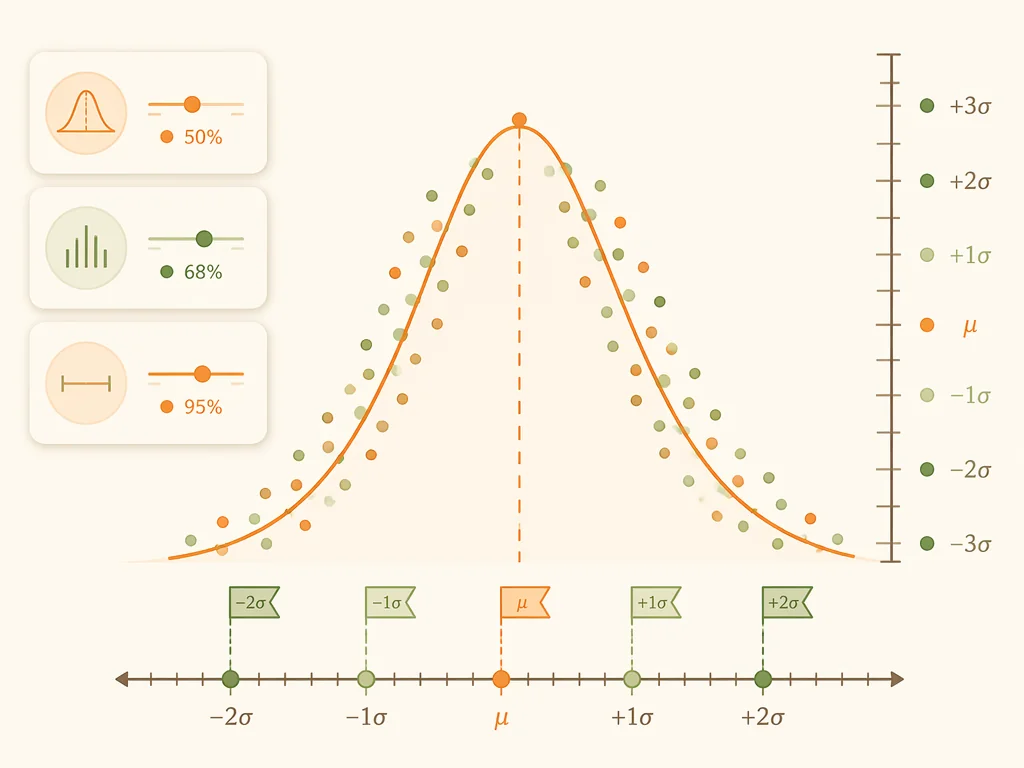
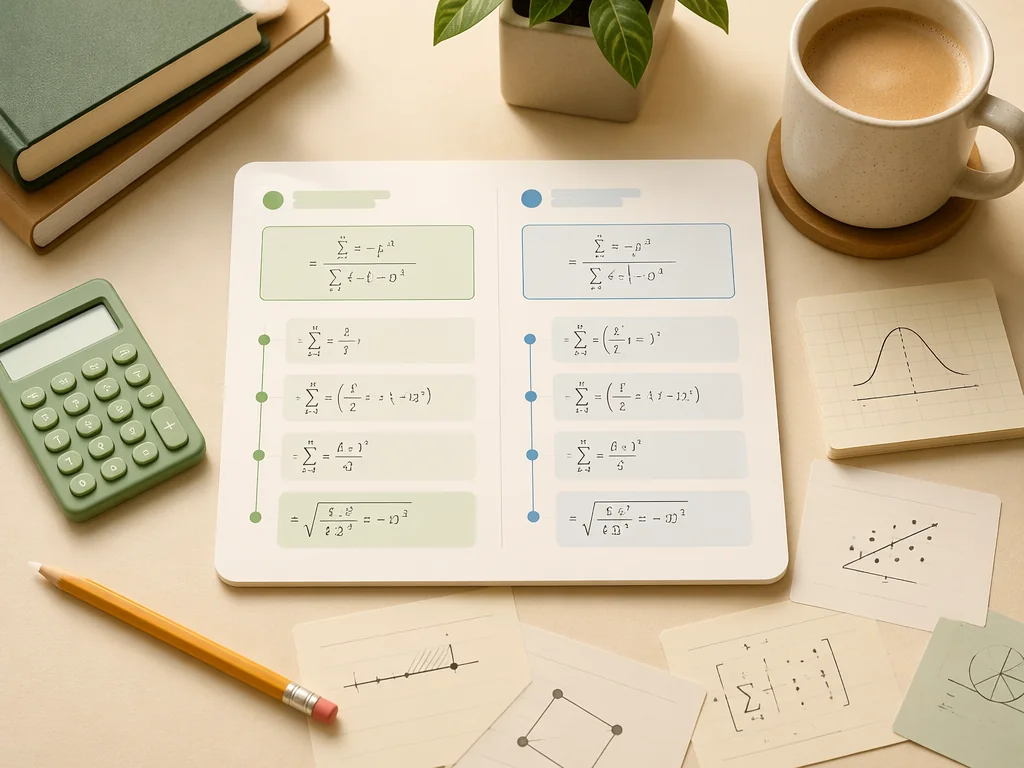
Knowing how spread out your data is matters just as much as knowing the average. This **statistics calculator** computes both sample (s) and population (σ) versions and displays the corresponding variance values alongside — since variance is simply the square of standard deviation, the two always come as a pair. Having both sample and population results side by side helps you avoid one of the most common mistakes in basic statistics. For students who want to dig deeper into formulas and theory, our AI math tutor can walk you through each concept with personalized explanations.
Central Tendency at a Glance — Find the Story Your Data Tells
Get all three measures of central tendency in one view so you can compare them instantly. The mean (arithmetic average) gives you the center of your data. The median identifies the middle value when your numbers are sorted — especially useful when your dataset has outliers that skew the mean. The mode shows which value appears most frequently, which is particularly helpful for categorical data analysis. Having all three in one view helps you choose the most appropriate measure for your specific situation.

How to Use the Statistics Calculator — 3 Simple Steps
Enter or Paste Your Data
Type your numbers directly into the input field, or copy and paste a column of values from Excel, Google Sheets, or a text file. Separate values with commas, spaces, or line breaks — the stats calculator automatically recognizes the format. You can enter whole numbers, decimals, or scientific notation.
Click Calculate and Get Instant Results
Press the calculate button and the statistics calculator instantly processes your dataset. All 13 statistical measures appear in a clean, organized result panel — count, sum, mean, median, mode, min, max, range, geometric mean, standard deviations, and variances. Every value is computed with full precision.
Review Your Complete Statistics Summary
Review all 13 statistical measures in a single clean results panel — no need to switch between multiple tools. Compare values side by side and quickly spot which measure best describes your dataset. For additional homework support across all subjects, try our AI homework helper to get guided explanations for any question.
Best Use Cases for This Online Statistics Calculator
Statistics Calculator for Students — Homework and Exam Prep
Check your manual calculations, verify homework answers, and understand each statistical concept with clear result displays. The statistics calculator helps you catch errors before submitting assignments and builds confidence for exams. Use it alongside our AI math solver to get instant photo-based solutions for any statistics problem you encounter in textbooks or worksheets.
Statistics Calculator for Teachers — Classroom and Grading
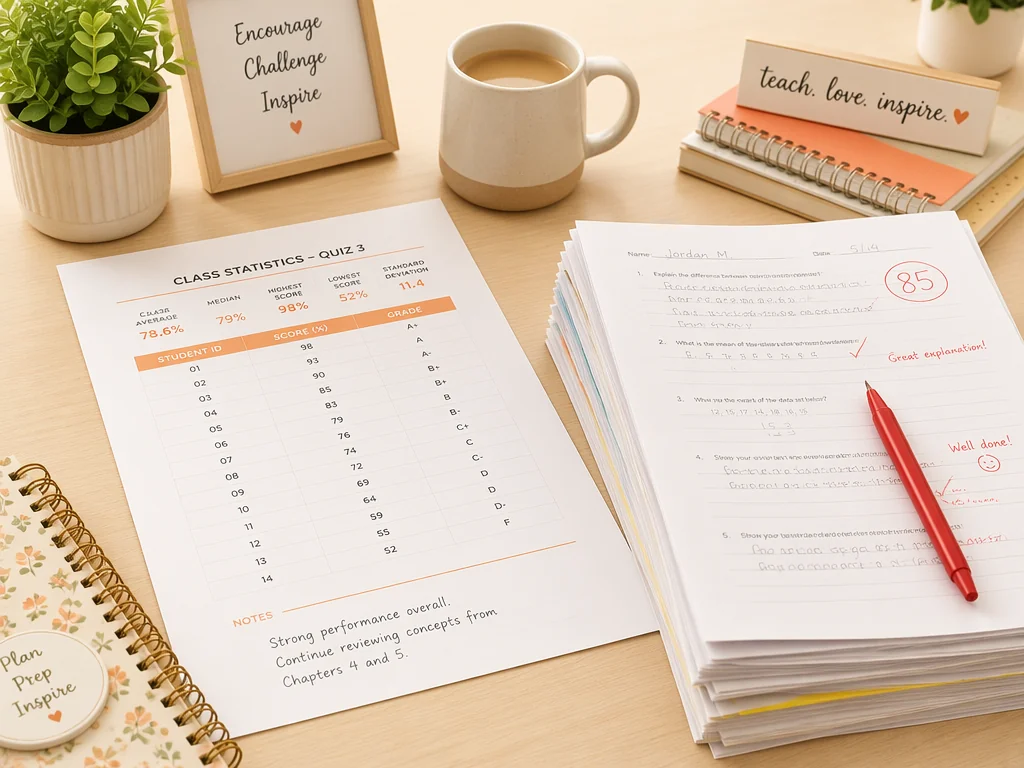
Quickly compute class averages, grade distributions, and performance summaries. The stats calculator saves time on manual number crunching so you can focus on interpreting results and giving students meaningful feedback. Generate summary statistics for test scores, attendance data, or survey results in seconds.
Statistics Calculator for Researchers — Quick Data Validation
Validate small to medium datasets before running larger analyses in specialized software. The statistics calculator online gives you an immediate sense of your data distribution — central tendency, spread, and range — so you can spot anomalies or data entry errors early. It works as a lightweight companion tool when you just need a quick descriptive overview without opening heavy statistical packages.
Statistics Calculator for Self-Learners — Build Data Literacy
Learning statistics on your own? This free statistics calculator helps you experiment with different datasets and immediately see how each statistical measure responds. Change a single value and observe how the mean shifts while the median stays stable. Add an outlier and watch the standard deviation increase. It turns abstract formulas into hands-on, visual learning. For a structured learning path with personalized guidance, our AI math tutor adapts to your pace and focuses on the areas where you need the most support.



Why Use Our Statistics Calculator Over Other Tools
All 13 Essential Statistics in One Place
Most online calculators only cover a few measures. This statistics calculator gives you count, sum, mean, median, mode, min, max, range, geometric mean, population standard deviation, population variance, sample standard deviation, and sample variance — all from a single data entry.
Step-by-Step Calculations You Can Follow
Unlike generic calculators that only output a single number, this stats calculator gives you all 13 descriptive measures at once, so you can see the full picture of your data without switching between tools or doing manual calculations.
Clear Sample vs. Population Distinction
One of the most common statistics mistakes is using the wrong type of standard deviation. This statistics calculator online gives you both population and sample results clearly separated, with both variance values shown alongside — so you always pick the right measure for your data without confusion.
Free, No Sign-Up, Works on Any Device
Start calculating immediately — no account creation, no email required, no credit card. This free statistics calculator works in any modern browser on desktop, tablet, or mobile. It is designed for quick access whenever and wherever you need to run a descriptive statistics summary.
Built by Educators, Not Just Engineers
This tool was designed with teaching and learning in mind. Every label, explanation, and step display is crafted to help users understand statistics — not just get a number. Our statistics calculator reflects a deep commitment to making math accessible and meaningful for learners at every level.
Part of a Complete Math Learning Ecosystem
The statistics calculator is not a standalone tool — it connects directly with AskMath's full suite of learning resources. After calculating your statistics, you can explore related math concepts or get personalized tutoring from the AI math tutor to deepen your understanding. Everything works together to support your learning journey.
What Users Say About Our Statistics Calculator







Get Instant Statistical Insights — Start Calculating Now, No Sign-Up Needed
Frequently Asked Questions About the Statistics Calculator
A statistics calculator is an online tool that computes descriptive statistical measures from a set of numerical data. It calculates values like mean, median, mode, standard deviation, variance, and range, helping users summarize and understand their data without manual computation or specialized software.
Simply enter your numbers into the input box — separate them with commas, spaces, or line breaks — and click Calculate. The stats calculator instantly returns all 13 statistical measures for each result.
Yes. This statistics calculator includes geometric mean calculation, which is especially useful for growth rates, ratios, and proportional data. The geometric mean is calculated by multiplying all values and taking the nth root, and the result appears alongside all other statistical measures in the results panel.
Yes. This is a completely **free statistics calculator** with no sign-up required. There are no usage limits, no premium plans, and no paid subscriptions needed — you can use it as many times as you want, whenever you need it.
This statistics calculator works well with datasets of various sizes. For very large datasets with thousands of values, performance may vary depending on your device and browser. For the best experience, we recommend datasets of up to a few hundred values for optimal performance.
This statistics calculator online is designed for speed and simplicity — no need to learn formulas, install software, or write code. While Excel and R offer more advanced capabilities, this tool is ideal for quick descriptive statistics whenever you just need instant results without setup.
No. AskMath takes privacy seriously. The data you enter into the statistics calculator is processed in real time for computation only and is not stored on our servers after your session ends. Your numbers remain your numbers. For complete details, please review AskMath's privacy policy.